Solver|Model Statistics |

Contents
The Model Statistics command lists summary statistics for your model. The statistics vary slightly depending on whether the model you’re working with is linear or nonlinear.
In the following example, we open the linear transportation model, TRAN.LG4, issue the Model Statistics command, and then discuss some of the details of the report. Here is the output generated by Model Statistics for TRAN.LG4:
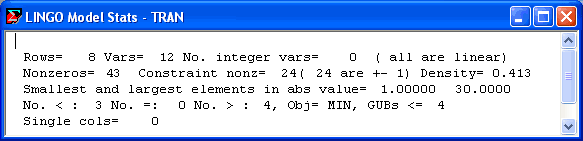
The statistics report consists of five lines.
In line one, the number of rows (constraints), variables (columns), and integer variables are shown. The report also specifies when the model is linear by stating that all variables are linear.
Line two of the report gives a count of the number of nonzero coefficients appearing in the model. The first count is the number of nonzero coefficients in the entire model. The Constraint nonz count is the number of coefficients on the left-hand sides of all the constraints, excluding the objective and nonzero right-hand side coefficients. Next, is a count of the number of constraint coefficients that are plus or minus one. In general, a linear programming model is easier to solve when the percentage of +/-1 coefficients increases. Finally, LINGO reports a density figure, which is defined as: (total nonzeros) / [(number of rows) * (number of columns + 1)]. For large models, densities under .01 are common. High densities can mean that a problem will take longer to solve.
Line three lists the smallest and largest coefficients in the model in absolute value. For stability reasons, the ratio of the largest coefficient to the smallest should, ideally, be close to 1. Also, in absolute terms, it is best to keep coefficient values in the range of 0.0001 to 100,000. Values outside this range can cause numerical difficulties for the solver.
Line four lists the number of constraints by type (<, =, and >), the sense of the objective, and an upper bound on the number of Generalized Upper Bound (GUB) constraints. A GUB constraint is a constraint that does not intersect with the remainder of the model. Given this, the GUB statistic is a measure of model simplicity. If all the constraints were nonintersecting, the problem could be solved by inspection by considering each constraint as a separate problem.
Line five lists the number of variables that appear in only one row. Such a variable is effectively a slack. If you did not explicitly add slack variables to your model and the single column count is greater than zero, then it suggests a misspelled variable name.
The following report was generated by the Model Statistics command for the nonlinear model, DNRISK.LG4:
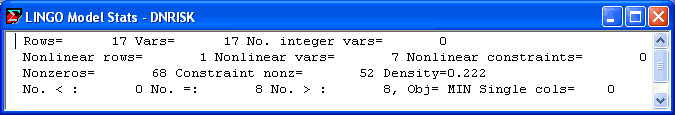
The statistics report for nonlinear models drops information about the range of coefficient values, the number of +/-1 coefficients, and the GUB upper bound. A count of the number of nonlinear variables and rows is added in line two. The nonlinear rows count includes the objective, while the nonlinear constraint count does not.