Charting Solutions |
|

Contents
If you choose to have the solution displayed as a chart, the box titled Chart Properties will be undimmed, which allows you to select options influencing the display of the chart.
In the Chart Type box, you have the option of selecting a bar, bubble, contour, curve, histogram, line, netarc, netnode, pie, radar, scatter or surface chart. One easy way to familiarize yourself with the various chart types is to open and run the sample model CHARTS.LG4, which displays a sample of each of the chart types.
If you've selected a histogram chart, then you will also have the option of specifying the number of bins in the histogram in the Histo Bins box. If the number of bins is set to 0, then LINGO will select a reasonable number of bins for the given data set.
In the Values box, you can select to graph either primal or dual values.
The Attribute(s) or Row Name(s) field works in the same way as mentioned in the previous section, with the additional feature that a colon may be inserted in between object names to indicate that you wish to display multiple series on the same graph. Each series of data will be displayed using a different color. The chart types that support multiple series are: bar, bubble, curve, line, radar, scatter. Contour, histogram, pie and surface charts do not support multiple data series. As an example, consider the following staff scheduling model, similar to the one discussed above in section A Staff Scheduling Problem:
MODEL:
SETS:
DAYS: REQUIRED, START, ONDUTY;
ENDSETS
DATA:
DAYS = MON TUE WED THU FRI SAT SUN;
REQUIRED = 20 16 13 16 19 14 12;
ENDDATA
MIN = @SUM( DAYS( I): START( I));
@FOR( DAYS( J):
ONDUTY( J) =
@SUM( DAYS( I) | I #LE# 5:
START( @WRAP( J - I + 1, 7)));
ONDUTY( J) >= REQUIRED( J)
);
END
Model: STAFFDEM2
The ONDUTY attribute tells us how many employees are working on each day of the week. To display a bar chart of this information, you would fill out the Solver|Solution dialog box as below:
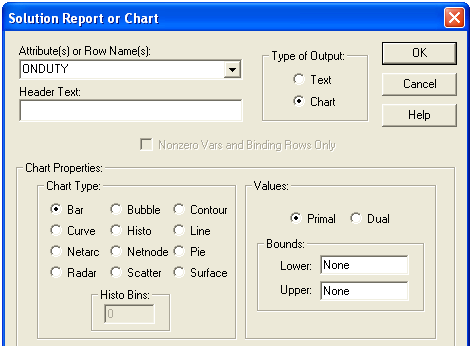
After pressing OK, a new window will open with the desired chart:
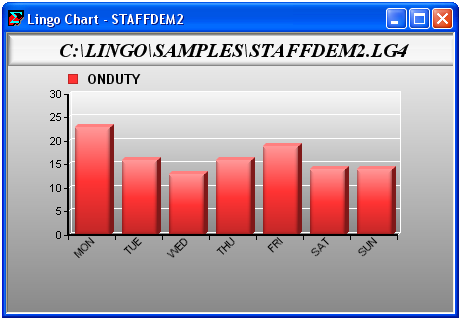
Along with charting the number on duty, it would also be useful to include the number of staffers required on each day. This would allow us in one glance to quickly see the days (if any) where we are over staffed. To do this, change the contents of Attribute(s) or Row Name(s) field from "ONDUTY" to "ONDUTY : REQUIRED". This tells LINGO we want to view both on duty and required staffing levels, with the colon inserted to indicate they should be displayed as separate series. Doing this yields the multi-bar chart:
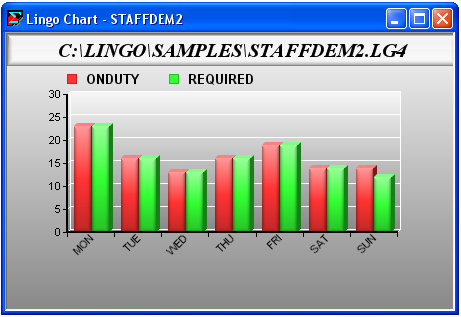
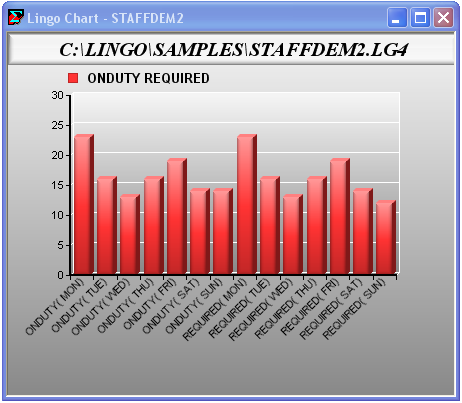
Here we see that we just meet our staffing needs Monday through Saturday and are over staffed slightly on Sunday. Had we not inserted the colon separator between the attribute fields, then LINGO would have displayed the two attributes as a single series:
The Bounds box gives you the option of placing bounds on the values to be included in the graph. If a number is entered in the Lower bound field, LINGO will only display points in the graph that are greater-than-or-equal-to the value. Conversely, if a value is placed in the Upper bound field, LINGO will only graph points less-than-or-equal-to the bound. For example, if we display a bar chart showing the number of employees starting each day of the week we'd see the following:
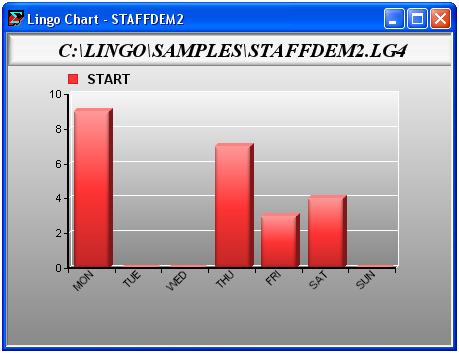
Notice there are several "holes" in the chart due to no one starting on Tuesday, Wednesday and Sunday. Entering a lower bound of .1 in the Bounds box removes the holes in our chart:
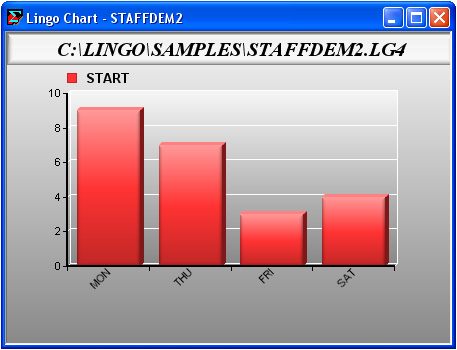
For charts with one-dimensional data (bar, histogram, line, pie and radar), the bounds will be applied to all data points in the first data series. If a point is eliminated in the first series, then the corresponding points in any additional series will also be eliminated, regardless of whether or not they lie within the specified bounds.
Charts with two-dimensional data points (curve and scatter) and three-dimensional data (bubble, contour and surface) will have the bound applied only to the x-axis data. If the x-axis value lies outside the bounds, then the entire point will be eliminated from the chart. Of these higher dimension charts, only curve scatter and bubble allow for multiple series. In this case, the bounds will be applied to the x-axis value of each series, as opposed to just the first.
| Note: | Bounds are not currently applied to the two network chart types - netarc and netnode. |
Next in the Chart Properties box are options for controlling how the axes and legends are labeled. In both cases, the choices are:
| • | Default - LINGO tries to make intelligent choices in choosing an appropriate labeling scheme. |
| • | None - No labels are displayed. |
| • | Set - Use one of the model's sets for labeling. Multiple sets may be specified, if needed, to supply sufficient labels. |
| • | User Specified - Labels are entered explicitly into the Set(s) or User Name(s) field, with individual labels being separated with colons. |
The final option in the Chart Properties box is the Use 3D and Shading checkbox. This option is on by default and will result in more modern looking charts that utilize shading and 3-dimensional effects. Disable this option to display simpler, 2-dimensional charts that may display better on certain printers.