Solver|Solution |
|
|

Contents
Use the Solution command to generate a solution report for the active window. After selecting the model window that you want to generate a solution for, issue the Solver|Solution command and you will be presented with this dialog box:
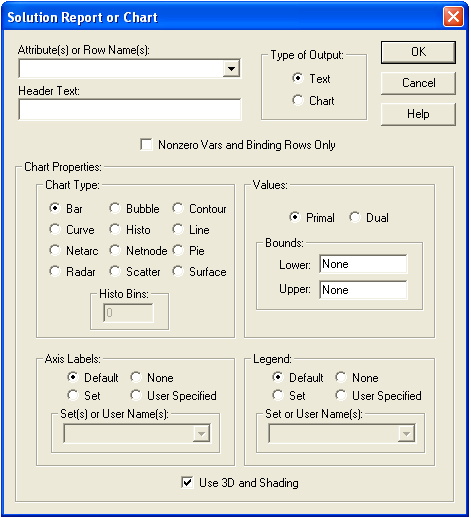
By clicking on the appropriate radio button on the Type of Output box, the solution report may be viewed in either text or chart format. If you select Text, LINGO will create a new window containing the solution in text format. If you select Chart, LINGO will create a new window containing the solution in one of several different graphical formats. Current supported chart formats are: bar, bubble, contour, curve, histogram, line, pie, radar, scatter and surface.
| Note: | LINGO maintains only one solution in memory. This is the solution to the last window you issued the Solver|Solve command for. If you try to issue the Solution command for a window that LINGO does not currently have a solution, you will receive an error message. Thus, if you plan to work with two or more models that take a long time to solve, be sure to save copies of your solutions. This will allow you to refer to them later without having to re-solve your models. |
| Note: | At present, the charting features of the Solution command are only supported in Windows versions of LINGO. However, Mac and Linux versions of LINGO can generate charts using the @CHART function set. |