
LINDO has recently added several models in its MODELS library devoted to modeling pandemics. One What’sBest! model, Covid19-Apr24.xlsx, models the growth over time of the number of people who have tested positive over time for covid-19 in Illinois. This model was developed by Pricha Pantumsinchai at https://www.m-focus.co.th/ . This model shows that one can do a good job of predicting new covid-19 cases using a variant of the model developed by Frank Bass for predicting new product adoption. Below is a graph from the spreadsheet: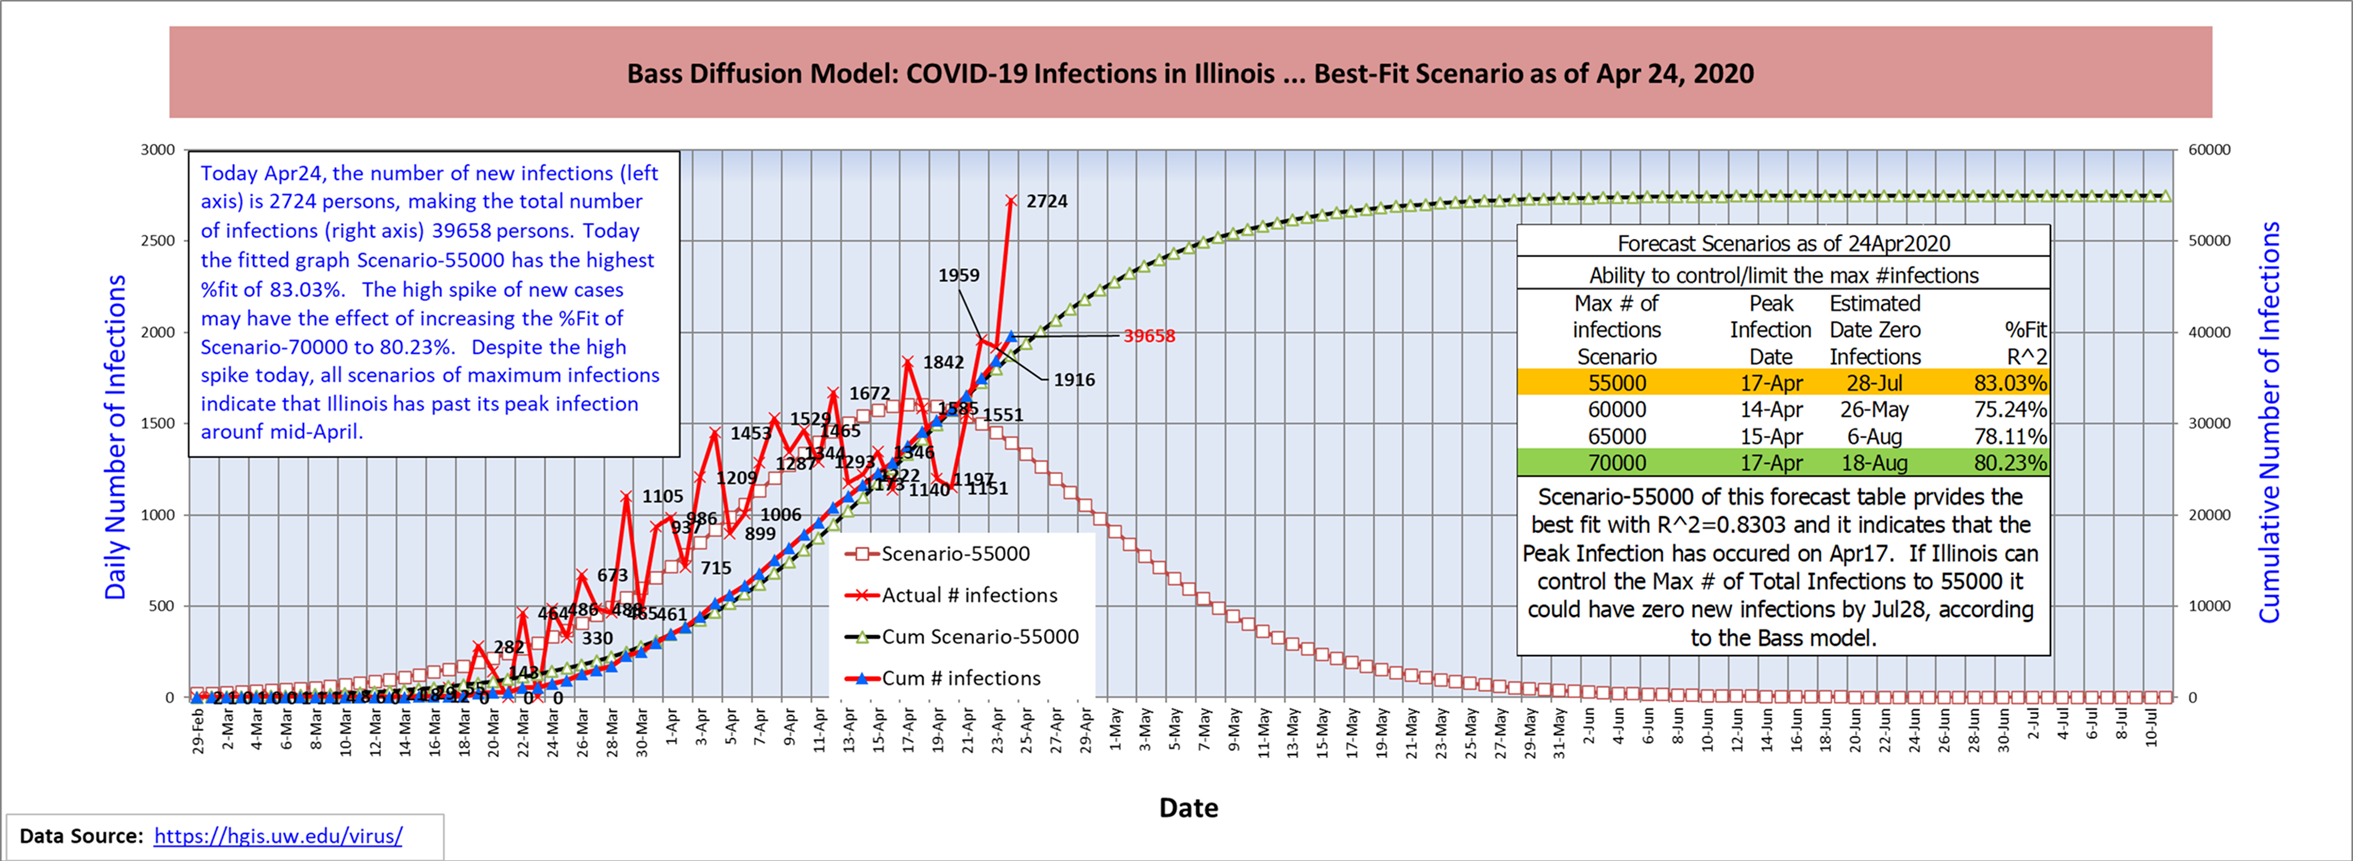
The What’sBest! optimizer is used to minimize the sum of squared errors of fitting the model (the smooth curves) to the data (the more erratic curves).
A second model added to the library is PandemicEst03.xlsx. It contains data on the daily covid-19 deaths in several U.S. states as well as several countries such as Italy, Germany and others. It predicts future deaths using the SIR ( Susceptible -> Infected -> Recovered) epidemic model. The SIR model is similar to the Bass model but instead of having two population segments, Not-infected vs. Has-been-infected, it has three: Susceptible, Infected, and Recovered. There are three important probabilities in the SIR model: the probability of getting infected by contact with an infected person, the probability of recovering from the infection on a given day, and the probability of dying from the infection. The key feature of the model, similar to the Bass model, is that the probability of a susceptible person getting infected is proportional to the fraction of the population that is currently infected and contagious. Both the Bass and the SIR models do a good job of modeling the typical S shaped curve that an epidemic follows. What’sBest! is used to find the transition probabilities that do the best job of fitting the model to the data.
A third model added to the library is Pandemic05.lng. It is a generalization of the basic SIR model in that it allows you to partition the population into groups, such as by age or by geography, and then specify the infection probabilities within and between groups. Adding this additional detail allows one to demonstrate a somewhat unsettling phenomenon that an infection may appear to die out in one group and then come back later at an even greater level. It uses the programming and graphing abilities of LINGO to predict the behavior of an epidemic over time. The graph below illustrates.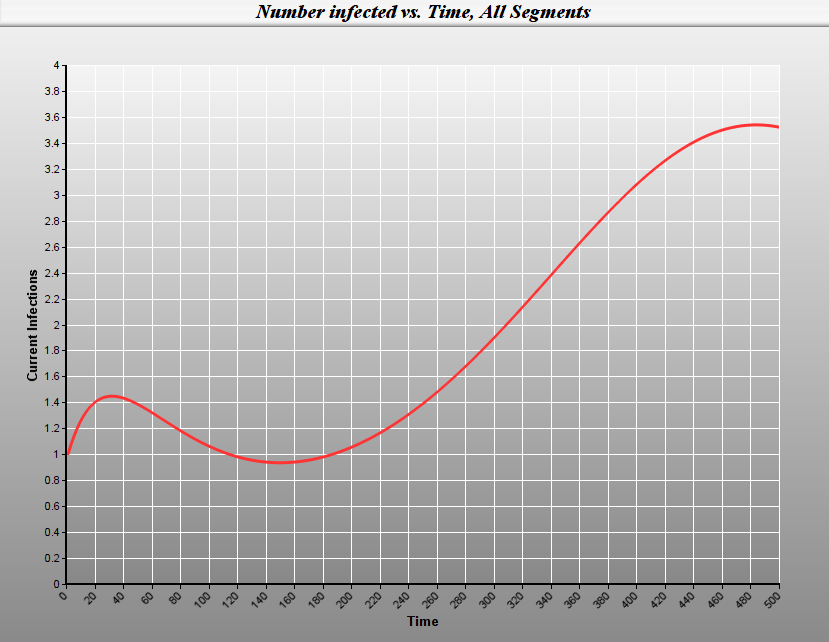
You can use the models to test out your own scenarios of how an epidemic might evolve. All of the models can be downloaded from www.lindo.com . Select MODELS | Keywords Index and search on pandemic.
LINDO products and pandemic models
| Support: (312)988-9421 | © 2026 LINDO Systems, Inc. | |
| Contact | Privacy policy | Acknowledgements | FAQ |